How to Diagnose Site Performance Using Google Search Console
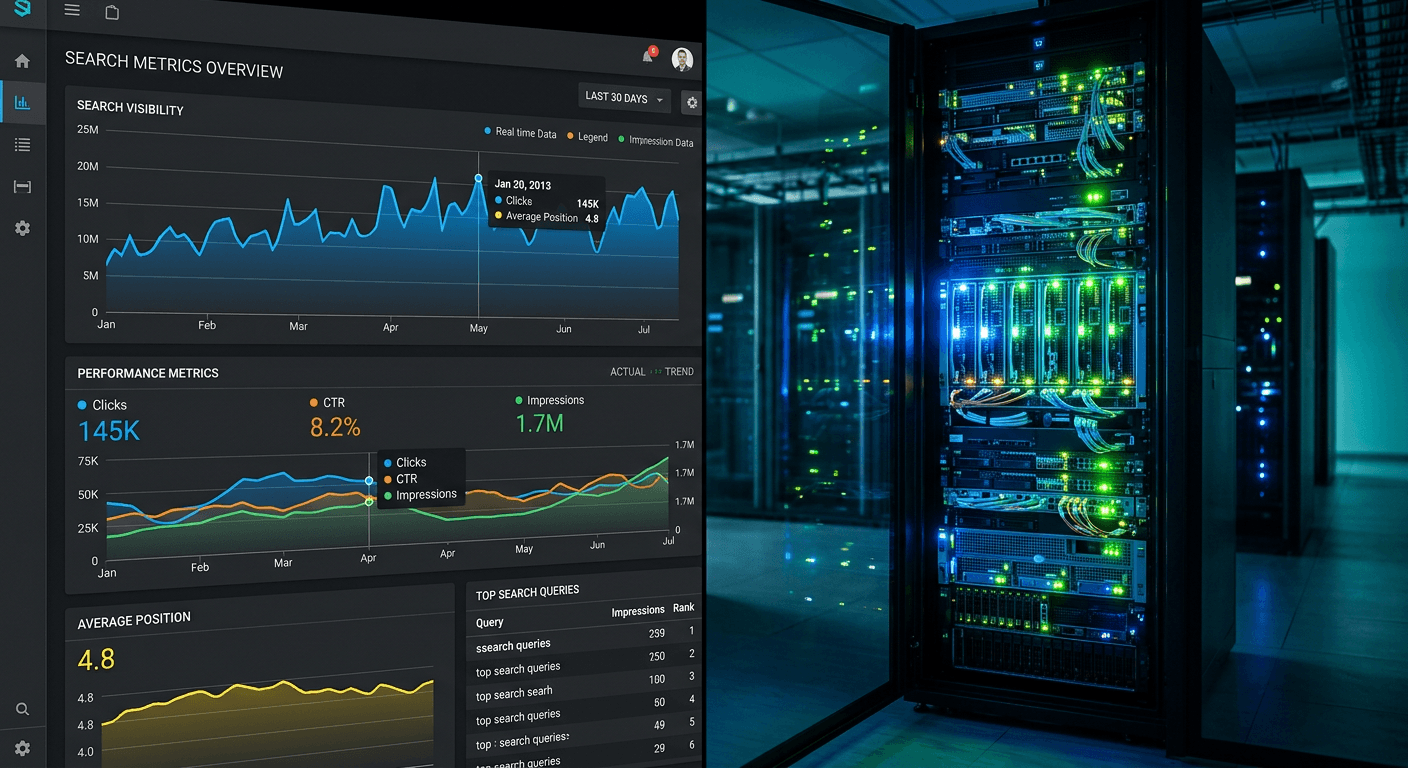
An SEO manager opens the analytics dashboard on Monday morning and sees organic traffic to a core regional directory has dropped 40% overnight. They immediately assume an algorithmic penalty. But a traffic drop is not a diagnosis. To find out what actually broke, practitioners need to read the server's dialogue with the search engine, and that dialogue is logged exclusively in the google search console.
Without direct access to crawl logs and indexation statuses, teams rely on guesswork. They rewrite content that simply was not crawled, or they request indexing for pages that the engine deliberately rejected. Operating this platform correctly requires understanding the difference between a site that ranks poorly and a site the crawler fundamentally cannot read.
Quick Summary
The Google Search Console provides direct telemetry from the search engine crawler to your server, revealing exactly how URLs are evaluated and displayed in search results. Monitoring this environment requires parsing indexation coverage, diagnosing server bottlenecks, and filtering aggregate performance data to extract actual user search intent.
- Domain-level DNS verification prevents blind spots across subdomains.
- Crawl budget limits dictate why discovered pages remain unindexed.
- Unfiltered average position metrics obscure true commercial performance.
- Core Web Vitals report 28-day historical field data, not current lab test scores.
Table of Contents
- 1. Google Search Console Domain Verification
- 2. XML Sitemap Prioritization
- 3. Performance Report Intent Extraction
- 4. Page Indexing Troubleshooting
- 5. Server Latency and Core Web Vitals
- Common Pitfalls & Troubleshooting
- FAQ
- Recommended Reads
1. Google Search Console Domain Verification
Why URL-prefix setups leave blind spots
Proving ownership of a website allows you to view its secure search telemetry. The platform offers two paths: URL-prefix and Domain property. URL-prefix verification relies on placing an HTML file in the root directory or adding a meta tag to the homepage. It only collects data for the exact protocol and string provided. If you verify https://www.example.de, any traffic hitting http://www.example.de, https://example.de, or a subdomain like https://shop.example.de simply does not record in your dashboard.
Domain property verification solves this fragmentation by authenticating at the DNS level. You add a TXT record to your domain registrar, which proves control over the entire domain architecture. This mechanism aggregates all protocols, subdomains, and trailing slash variations into a single, comprehensive data stream.
The mistake practitioners make here is choosing URL-prefix because it feels faster, uploading the HTML file, and moving on. Months later, they launch a localized subdomain or switch their canonical structure from non-www to www, and their traffic appears to flatline to zero. The traffic still exists, but the isolated URL-prefix property is blind to it. Furthermore, relying on an HTML file for verification frequently breaks during routine CMS updates or server migrations when the root directory gets cleared, revoking access precisely when you need diagnostic data the most. You must use the DNS TXT method to secure persistent visibility.
2. XML Sitemap Prioritization
Where raw URLs waste your crawl budget
A sitemap is a machine-readable directory that tells the crawler which pages matter and when they were last updated. Submitting this file does not force indexation; it establishes an architectural hierarchy and provides crawling hints. When a crawler arrives at your server, it operates on a limited crawl budget - a cap on the number of requests it will make based on server capacity and site authority.
The mechanics rely heavily on the <lastmod> (last modified) tag within the XML file. When functioning correctly, the crawler reads the index sitemap, checks the <lastmod> dates against its internal cache, and only spends its budget fetching URLs that have changed since the last visit.
The critical mistake people make is treating the sitemap submission tool as a brute-force indexation button. They build a flat XML file containing every URL on the server, including orphaned pages, tag archives, and parameter-laden search result pages. By feeding the crawler thousands of low-value URLs, they dilute the crawl budget. The engine wastes time parsing utility pages while newly published, high-value commercial articles sit in the queue. You must dynamically generate sitemaps that exclude noindex pages, canonicalized duplicates, and utility URLs. Check the "Coverage" stat specifically on the sitemap page - a "Success" status only means the file was parsed, not that the URLs inside it were deemed worthy of the index.
3. Performance Report Intent Extraction
How average position aggregates deceive practitioners
The Performance report is the only place you can see the exact search queries driving impressions and clicks to your site. An impression triggers whenever your URL appears in a search result page loaded by a user, regardless of whether they scroll down to see it. A click requires actual navigation to your server. The ratio between the two forms your Click-Through Rate (CTR).
The system calculates average position based on the highest-ranking URL from your property for a given query. If you have two pages ranking for "Berlin SEO agency" at positions 4 and 12, the recorded position for the site is 4.
Practical rule: Never evaluate a page's CTR or average position without first isolating branded search queries using an RE2 regex filter, because navigational brand searches artificially inflate your averages and mask poor non-brand performance.
The standard failure mode here is reporting on aggregate data. A practitioner looks at a landing page and sees an average position of 3.2 with a 15% CTR. They assume the page is highly optimized. But filtering the queries reveals that 90% of the clicks come from users typing the company's exact brand name, where the site ranks in position 1 with an 80% CTR. For the actual commercial intent queries - the non-brand services you are trying to sell - the page ranks in position 18 with a 0.5% CTR. By failing to segment brand versus non-brand intent using the custom regex filter (.*brandname.*), the practitioner draws the exact wrong conclusion about the page's market visibility.
4. Page Indexing Troubleshooting
Why crawled pages get rejected by the index
The Page Indexing report diagnoses the precise reason the search engine refuses to display a known URL. This environment separates failures into server-side bottlenecks and quality-based rejections. Understanding the distinction between "Discovered - currently not indexed" and "Crawled - currently not indexed" is mandatory for technical SEO.
"Discovered" means the crawler found the link, added it to the queue, but aborted the fetch. The mechanism here is self-preservation: the search engine's algorithm calculated that requesting the page would overload your server, so it backed off. Local infrastructure heavily influences this bottleneck. For German markets, routing requests through high-speed Frankfurt servers - the core architecture used by the platform RapidWombat - AI-Driven SEO for German Businesses - keeps latency under 50ms, allowing the crawler to process thousands of pages without triggering a protective timeout.
The mistake practitioners make is fundamentally misdiagnosing these two statuses. When faced with "Crawled - currently not indexed," they repeatedly hit the "Request Indexing" button. But a "Crawled" status confirms there was no server timeout; the bot successfully downloaded and parsed the HTML. The rejection was purely based on quality. The algorithm deemed the content too thin, entirely duplicative of another page, or simply not valuable enough to store in the index. Clicking "Request Indexing" on a page that fails the quality threshold accomplishes nothing. The only fix for a "Crawled" rejection is rewriting the content to provide unique value, consolidating it with a stronger page, or accepting that it does not belong in the index.
5. Server Latency and Core Web Vitals
When local infrastructure dictates field data
Core Web Vitals measure the real-world user experience of a page, focusing on loading performance, interactivity, and visual stability. These metrics act as a ranking tiebreaker in competitive search environments. The data populating this section of the console does not come from a controlled laboratory test; it is pulled directly from the Chrome User Experience Report (CrUX).
CrUX aggregates anonymized telemetry from actual Google Chrome users who visit your site. It operates on a rolling 28-day window. If a user in Munich accesses your site on a 3G mobile connection and experiences a slow Time to First Byte (TTFB), that sluggish response is logged and averaged into your overall score.
The critical failure here is ignoring the console's field data in favor of lab data from external testing tools. A developer runs a page through PageSpeed Insights on a local fiber connection, scores a 98/100, and declares the site optimized. They ignore the "Poor" URLs piling up in the console. The discrepancy occurs because lab tools simulate ideal conditions, while the console reports what happens when real users with older devices encounter geographically distant servers. If your target market is in Germany but your server is located in the US, the physical distance guarantees a high TTFB for your users, which directly tanks your Largest Contentful Paint (LCP) score in the console. You cannot fix field data with better local test scores; you fix it by moving the infrastructure closer to the user.
Common Pitfalls & Troubleshooting
Cannibalization of core queries
Symptom: A high-value search query shows an average position that fluctuates wildly week over week, jumping from position 4 down to 15, then back up.
Diagnosis & Fix: You are experiencing keyword cannibalization. Switch the Performance report to the exact query, then click the "Pages" tab. You will likely see two or more distinct URLs from your site swapping traffic for the same term. The engine cannot determine which page is the primary authority, so it rotates them. The fix is consolidating the competing pages using a 301 redirect or implementing a definitive rel="canonical" tag pointing to the preferred URL.
Invalid custom regex filters
Symptom: You apply a custom regex filter in the Performance report to track a specific set of product SKUs, and the chart instantly drops to zero data.
Diagnosis & Fix: The system uses RE2 regular expression syntax, which is strict about escape characters and boundaries. A common error is using unescaped hyphens or failing to use the | (OR) operator correctly. The fix is testing your syntax in an external RE2 validator. For simple inclusive lists, wrap the terms in parentheses and separate them with pipes: (term1|term2|term3).
The ghost data discrepancy
Symptom: When you sum the total clicks listed in the individual queries table, the number falls significantly short of the total clicks reported at the top of the performance chart.
Diagnosis & Fix: This is not a tracking error; it is an intentional privacy filter. The system anonymizes and hides search queries made by a very small number of users. The top chart shows the true aggregate total, while the table only shows statistically significant queries. The fix is relying on the top-level chart for volume reporting, and using the query table strictly for intent extraction and optimization targeting.
FAQ
How long does data take to appear in the dashboard
New properties typically take 48 hours to begin displaying data. This delay occurs because the system processes raw logs into structured metrics before visualizing them. Even for established properties, the most recent data is usually 24 to 48 hours behind real-time.
Why does the traffic count differ from Google Analytics
Analytics tracks user sessions via JavaScript executing in the browser, while the console logs clicks directly from the search engine result page. Ad blockers, cookie consent banners (common under GDPR), and users abandoning the page before the analytics script fires will cause Analytics to report fewer visits than the console's click count.
Can I track hyper-local search data for specific German regions
The default Performance report only allows filtering down to the country level. To track hyper-local intent (e.g., searches strictly within Bavaria or Berlin), you must analyze query strings containing regional modifiers natively in the console, or export the data into BigQuery and join it with localized session data from your analytics platform.
How far back does the performance history go
The platform retains exactly 16 months of historical data. If you need to conduct long-term year-over-year analyses beyond that window, you must manually export the data via the API or set up an automated monthly export to a secure data warehouse.